Applications of Time-Frequency Analysis Techniques on Machinery Fault Diagnosis
ZhuangLi, Lin Liu & Suri GaneriwalaSpectraQuest Inc., 8227 Hermitage Road, Richmond, VA 23228
Published: August,. 01 2006
Abstract
Generally speaking the sound and vibration signals obtained from a rotating machine are time-variant since they are strongly related to the rotational speed which is not constant even in the macro steady state. Since the mostly used signal processing method, the Fourier analysis, is only suitable for stationary signals, the development of the joint time-frequency analysis is demanded. Both the linear and quadratic time-frequency analysis approaches have been introduced. The performances of these algorithms were compared. Several tips were then summarized for you to pick an appropriate method for your application. Several successful applications of the time-frequency analysis methods on the machinery fault diagnosis were presented in detail.
Introduction
For scientists and engineers, a system under study is usually considered as a black-box. In general cases people only can obtain useful information by analyzing the measured signals acquired from the system. Therefore, the signal processing techniques are helpful and indispensable tools for us to extract useful information and features associated with the system. The last several decades have seen many innovative signal processing approaches developed, and some of them have already found successful applications in machinery fault diagnostics. Wavelet transform, short-time Fourier transform, Gabor expansion, Wigner-Ville distribution (WVD), cepstrum, bispectrum, correlation method, high-resolution spectral analysis, statistical analysis, etc. are all hot topics nowadays. How to select an appropriate method for a particular problem is then an interesting question. Spectra Quest, Inc. is planning to publish a series of tech notes on the applications of advanced signal processing techniques on machinery fault diagnosis. For the purpose of simplicity, we will try to avoid presenting theories behind these techniques. These tech notes are going to focus on the industrial applications with plenty of examples. Advantages, disadvantages, and suitable applications will be discussed for each technique. The performance of some related techniques will be further compared.

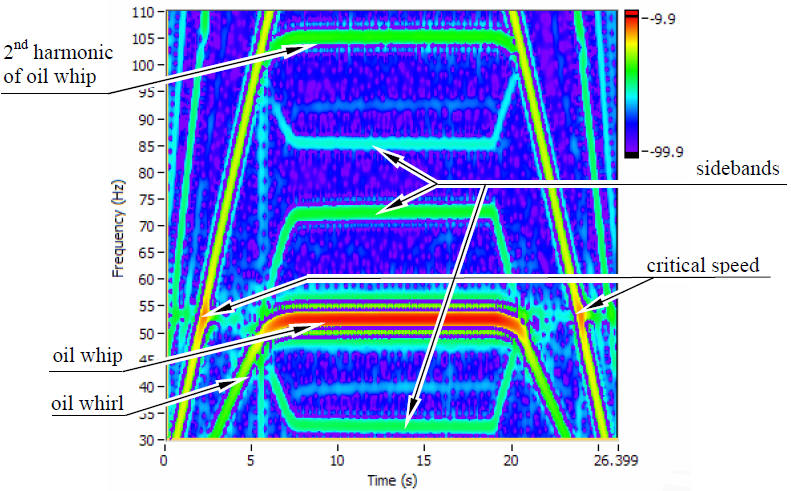
Fig 1. Zoomed Gabor spectrogram of the oil whip component

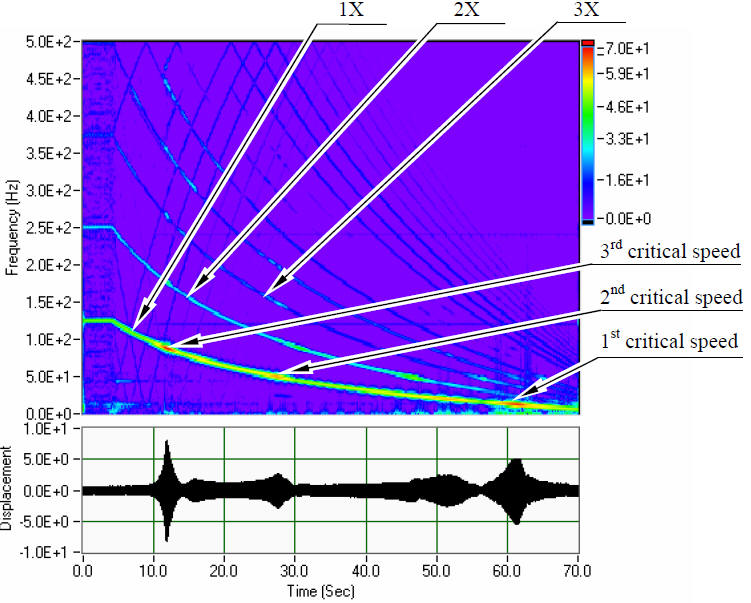
Fig 2. Gabor transform of a shut-down test on MFS Lite Extended


