


Advanced Signal Processing of a Gearbox Vibration Signal with a Defective Rolling Element Bearing
Nader Sawalhi and Suri Ganeriwala1.Prince Mohammad Bin Fahd University, Khobar, Saudi Arabia nsawalhi@pmu.edu.sa
2 SpectraQuest, Inc., Richmond, USA suri@spectraquest.com
Published: April, 07 2015
Abstract
This paper provides a systematic signal processing of a vibration signal measured from a gearbox driven by a three phase motor, which is controlled by a variable frequency drive (VFD). The vibration signal being processed was obtained from a test rig with a defective bearing, thus the signal represents a rich content of different types of signals. Power spectrum density (PSD) and time-frequency analysis (using Morlet wavelets) were used after a visual inspection of the signal in the time domain. The sidebands in the vicinity of the VFD carrier frequencies were used to verify the speeds of each shaft in the gearbox and to provide information about the amount of slippage between the VFD frequency and the shaft speed. As no information was provided at the time of analysis about the number of teeth of each gear, order tracking and harmonic/sideband cursors were used to deduce this information and to later obtain a synchronous average for each shaft and a residual signal for the diagnosis of the bearing fault. Finally, Bearing diagnosis was performed on the residual signal obtained earlier using a semi-automated bearing diagnosis tool which includes whitening the signal, removing the transfer path effect using minimum entropy deconvolution (MED) and finding the best band for envelope analysis using spectral kurtosis (SK).
Keywords: Gearbox, Rolling Element Bearings, Variable Frequency Drive, Order Tracking, Envelope Analysis.
Introduction
Vibration signals acquired from gearboxes contain rich information about the health of gears and bearings. The analysis of acquired signals requires the knowledge of the number of gear stages, the number of teeth on each gear and the input or output angular velocities. A tachometer signal (speed reference) is usually acquired along with the vibration signal. The presence of the tachometer signal provides the means to estimate speed variations and to remove speed fluctuations from the vibration signal using angular re-sampling (also known as order tracking) [1]. In the absence of a tachometer signal, the vibration signal itself can be used to extract this information [2, 3], which can be then used for order tracking [4, 5]. If no information is available about the number of teeth in each gear, the order tracked signal can be used to mine this information by setting families of harmonic and sideband cursors and fine tuning these families to estimate the number of teeth for each pinion/gear [6]. The use of time-frequency presentation has been discussed in a number of publications and can be utilized very efficiently for the gear signals, e.g. [1, 7, 8]. Bearing fault diagnosis in gearboxes has been discussed in a number of publications, e.g. [9, 10, 11].
In this paper, the processing of a vibration signal from a gearbox with a defective bearing is discussed. The paper serves the purpose of providing a systematic means of handling and processing vibration signals from VFD driven gearboxes. The paper is organized as follows: after this introductory section, the gearbox test rig from which the vibration signal was acquired is presented in section 2. Section 3 discusses the different stages of processing to provide an understanding of the different features and frequencies presented. This includes inspecting the time domain signal, the frequency domain (using power spectrum density), the time-frequency joint presentation, the order tracked signal and shaft synchronous averages. The bearing fault diagnosis is discussed in section 4 utilizing the semi-automated approach presented in ref [12]. Section 5 provides a summary and conclusions, while Sections 6 and 7 are the acknowledgment and references sections respectively.
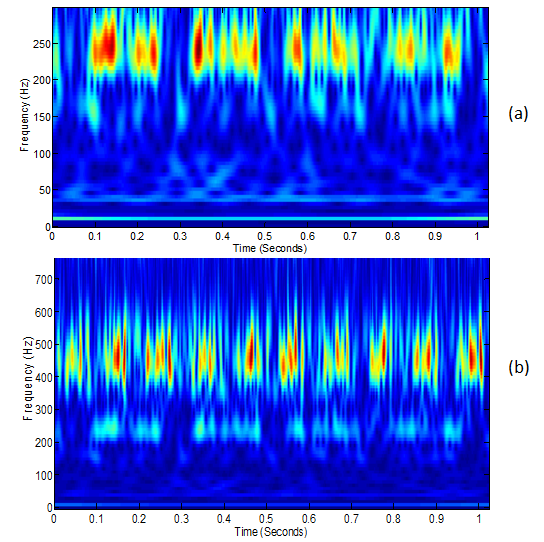
Figure 1: Time-Frequency analysis using Morlet wavelets (a) A zoom in analysis between 0 and 250 Hz (b) A zoom in analysis between 0 and 700 Hz
Morlet Wavelet analysis[14] was selected to provide a sense about the time-frequency content for the vibration signal. It is not an aim of this paper to compare between the different time-frequency presentation, but rather to show a sample of what can be gained from such analysis. Time-frequency analysis normally provides information about speed fluctuations, transient events, verification of information obtained from time and frequency domain data, extra observation such distinguishing between electrical and mechanical faults, signal modulation and more. The major two intense region in the time-frequency plot (figure 1.a and 1.b) are noticed around the 450 Hz and the 250 Hz. These are thought of as the 1st and 2nd gear mesh frequencies respectively. At around 450 Hz (figure 1.a) approximately 10 events in one second are observed. This corresponds to a modulation of approximately 10 Hz and corresponds to the intermediate shaft frequency. This was observed as a side bands at 9.577 Hz (see figure 1.a) around the VFD carrier. At around 250 Hz (figure 1.b) four major events in one second can be seen. This corresponds to a modulation of approximately 4 Hz which is recognized as the low speed shaft.